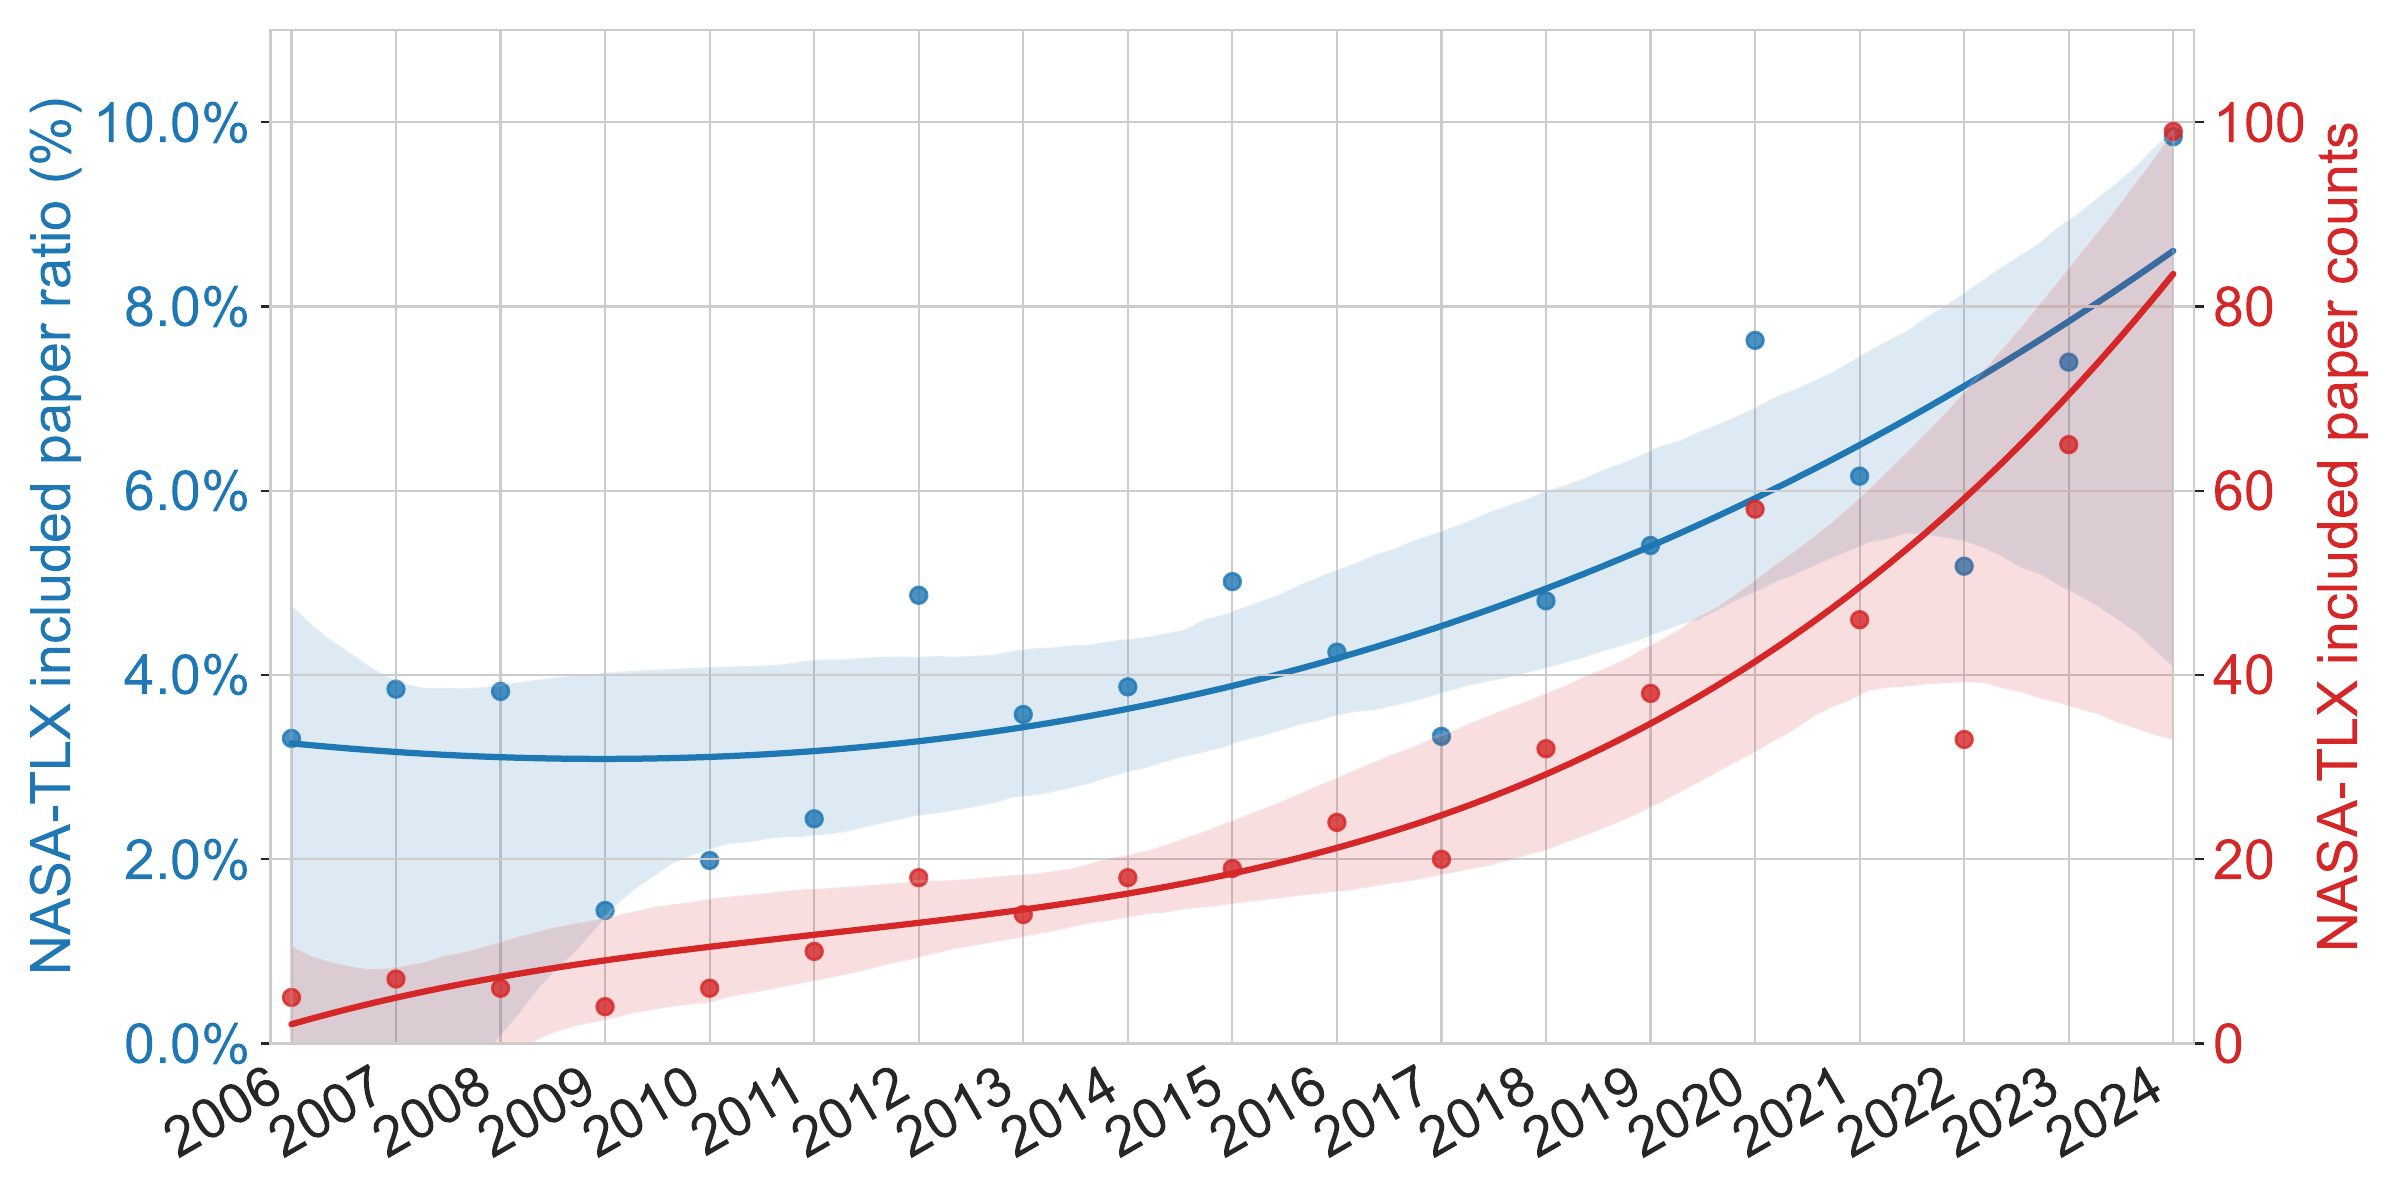
NASA-TLX use at CHI from 2006 to 2024. Blue is the share of all CHI papers including NASA-TLX, rising from about 3% to nearly 10%; red is the raw paper count, rising from 5 papers to 99.
The NASA Task Load Index, or NASA-TLX, is a short questionnaire that asks people to rate how mentally and physically demanding a task felt. It is one of the most popular tools in human-computer interaction research (and often used at CHI, one of the premier interantional HCI conferences).
The NASA Task Load Index appeared in roughly one in ten CHI papers last year. It has become close to a default instrument, which is exactly why we should ask whether we are all using it the same way. We read 522 CHI papers from 2006 to 2024 to find out. The short answer: the instrument itself is fine; the problems lie in how we implement it. Our paper is now accepted at ACM TOCHI, and with the next CHI deadline approaching, this is a good moment to check your own setup.
What to do differently
Six things, in the order you would encounter them when running a study.
Check that workload is what you actually want to measure. The NASA-TLX gives you a multidimensional subjective measure, and it works best paired with objective performance metrics. It is also not ratio-scale data, so an 80 is not twice as demanding as a 40. It is designed for comparing conditions, not for absolute statements.
Explain every subscale to your participants. Show the full description, not just the name, and keep the verbal anchors rather than bare numbers. Define a concrete task as well. “Select the target as fast as you can” gives you a usable measurement; “use the system” gives you a rating of a general vibe.
Watch the Performance subscale. It runs in the same direction as the other five, so higher means worse. Participants do not expect this, and neither do some authors. If you collect it reversed, flip it back before analysis and say so in the paper.
Use the original 21-point scale and report on a 0-to-100 range. That means 0 to 100 in steps of 5. Coarse 5- or 7-point versions are common, probably because they match other Likert items in a questionnaire battery, but our data show they distort the structure of the measurement.
If you have no comparison condition, run the pairwise comparisons. All 15 of them. They tell you which dimensions actually drive workload for your task, and they give you a per-participant consistency check. If someone rates Physical Demand above Performance but the binary comparisons say the opposite, you probably have a labelling problem.
If you have to shorten the instrument, use Short-TLX. Keep Mental Demand, Physical Demand, and Performance. Those three carry the most independent information. State which subscales you dropped and why.
Why we say that
The growth is the easy part to describe. Five papers used the NASA-TLX at CHI 2006; 99 used it in 2024. Across the whole period it appears in 522 papers, or 5.41% of everything CHI published. The device mix moved with the field: desktop and laptop studies dominated the early years, and HMDs and smartglasses are now the largest group.
The reporting is the harder part. Only 17 of the 522 papers ran the pairwise weighting step. 340 never said how many divisions their rating scale had. 79 reported no statistical test at all, just raw values. Most studies otherwise look broadly alike—88% are within-subject, with around four conditions and about 29 participants—but the details that would let you compare across papers are frequently missing.
Then we went a level deeper. We pulled subscale values from 683 tasks in 185 papers, which mostly meant clicking data points off published bar charts and box plots with a custom annotation tool, and reanalyzed them the way Hart and Staveland analyzed their original data. The subscales correlate much more strongly in HCI than they did in the 1988 study: Effort with overall workload at .90, Frustration at .88, Mental Demand at .85. Performance sits apart at .59.
A factor analysis says the same thing more precisely. Four subscales group into two related factors: a cognitive-affective factor holding Mental Demand, Temporal Demand, Effort, and Frustration, and a physical factor holding Physical Demand. Performance does not fit either, with a communality of only .178. Part of that separation is real, since rating your own outcome is a different kind of judgment than rating your own exertion. Part of it is the direction problem from point 3 above, showing up as noise in the aggregate.
The scale-granularity result was the one I found most convincing. With the original fine-grained scale, Frustration loads onto the cognitive-affective factor, which is where it belongs for a cognitive task. With 5- and 7-point scales, it loads onto the physical factor instead. Same construct, coarser instrument, wrong structure. That is a concrete reason to keep the 21 options rather than treating it as a matter of tradition.
The toolkit
Guidelines are easier to follow when something implements them for you, so we built one. The response collection app uses the 21-point scale by default, lets participants click or tap anywhere on the scale without ever requiring a drag, highlights the Performance endpoints to prevent the reversal error, and lets you switch weighting off, on globally, or on per task. You can toggle individual subscales if you are running STLX. It exports CSV, all text is localizable, and it is open source. Translations are very welcome.
It also ships teaching material, because a participant who understands the subscales gives you better data than one who is guessing. There is a 10-minute video explaining each dimension, and a small arithmetic game where participants play two difficulty levels and then say which subscale went up, with feedback against expert labels.
Separately, there is an interactive database of all 522 papers, filterable by year, device category, participant count, and analysis method. It is useful for finding out what comparable studies did before you commit to your own design.
Reference
Juyoung Lee, Thad Starner, Kai Kunze, Thomas Kosch, Maria Pospelova, and Woontack Woo. 2026. NASA-Task Load Index in CHI: A Comprehensive Review and Subscale Meta-Analysis with Implementation Guidelines. ACM Trans. Comput.-Hum. Interact. (Just Accepted). https://doi.org/10.1145/3837858